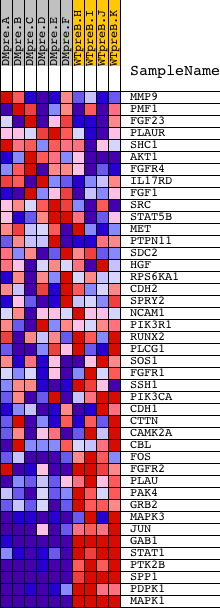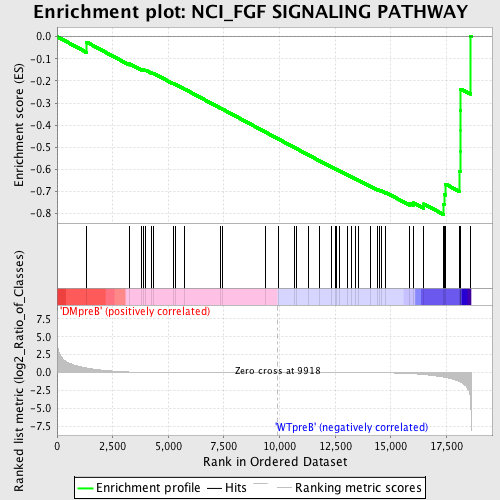
Profile of the Running ES Score & Positions of GeneSet Members on the Rank Ordered List
| Dataset | Set_04_DMpreB_versus_WTpreB.phenotype_DMpreB_versus_WTpreB.cls #DMpreB_versus_WTpreB |
| Phenotype | phenotype_DMpreB_versus_WTpreB.cls#DMpreB_versus_WTpreB |
| Upregulated in class | WTpreB |
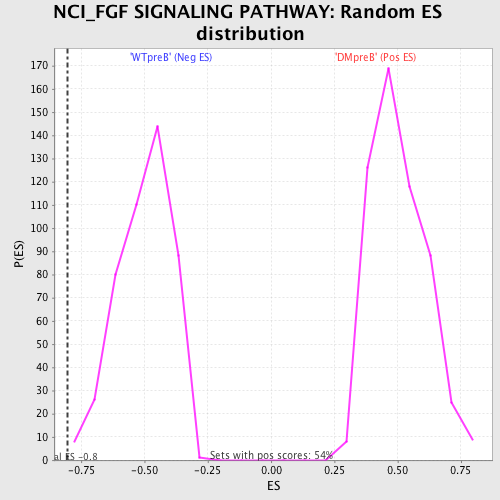
| GeneSet | NCI_FGF SIGNALING PATHWAY |
| Enrichment Score (ES) | -0.80353445 |
| Normalized Enrichment Score (NES) | -1.6108855 |
| Nominal p-value | 0.0043763677 |
| FDR q-value | 0.046330005 |
| FWER p-Value | 0.358 |
| PROBE | DESCRIPTION (from dataset) | GENE SYMBOL | GENE_TITLE | RANK IN GENE LIST | RANK METRIC SCORE | RUNNING ES | CORE ENRICHMENT | |
|---|---|---|---|---|---|---|---|---|
| 1 | MMP9 | 14732 | 1321 | 0.631 | -0.0245 | No | ||
| 2 | PMF1 | 12452 | 3247 | 0.082 | -0.1221 | No | ||
| 3 | FGF23 | 17275 | 3814 | 0.047 | -0.1491 | No | ||
| 4 | PLAUR | 18351 | 3886 | 0.044 | -0.1497 | No | ||
| 5 | SHC1 | 9813 9812 5430 | 3966 | 0.042 | -0.1508 | No | ||
| 6 | AKT1 | 8568 | 4238 | 0.034 | -0.1629 | No | ||
| 7 | FGFR4 | 3226 | 4311 | 0.032 | -0.1644 | No | ||
| 8 | IL17RD | 22069 | 5220 | 0.019 | -0.2119 | No | ||
| 9 | FGF1 | 1994 23447 | 5337 | 0.018 | -0.2169 | No | ||
| 10 | SRC | 5507 | 5732 | 0.014 | -0.2370 | No | ||
| 11 | STAT5B | 20222 | 7328 | 0.007 | -0.3224 | No | ||
| 12 | MET | 17520 | 7437 | 0.006 | -0.3278 | No | ||
| 13 | PTPN11 | 5326 16391 9660 | 9360 | 0.001 | -0.4312 | No | ||
| 14 | SDC2 | 9134 | 9961 | -0.000 | -0.4634 | No | ||
| 15 | HGF | 16916 | 10648 | -0.002 | -0.5003 | No | ||
| 16 | RPS6KA1 | 15725 | 10766 | -0.002 | -0.5064 | No | ||
| 17 | CDH2 | 1963 8727 8726 4508 | 11295 | -0.003 | -0.5346 | No | ||
| 18 | SPRY2 | 21725 | 11810 | -0.005 | -0.5619 | No | ||
| 19 | NCAM1 | 5149 | 12342 | -0.007 | -0.5900 | No | ||
| 20 | PIK3R1 | 3170 | 12501 | -0.008 | -0.5979 | No | ||
| 21 | RUNX2 | 4480 8700 | 12563 | -0.008 | -0.6006 | No | ||
| 22 | PLCG1 | 14753 | 12673 | -0.009 | -0.6058 | No | ||
| 23 | SOS1 | 5476 | 13043 | -0.010 | -0.6249 | No | ||
| 24 | FGFR1 | 3789 8968 | 13224 | -0.012 | -0.6338 | No | ||
| 25 | SSH1 | 10540 | 13428 | -0.013 | -0.6437 | No | ||
| 26 | PIK3CA | 9562 | 13536 | -0.014 | -0.6484 | No | ||
| 27 | CDH1 | 18479 | 14069 | -0.020 | -0.6756 | No | ||
| 28 | CTTN | 8817 4575 1035 8818 | 14401 | -0.027 | -0.6914 | No | ||
| 29 | CAMK2A | 2024 23541 1980 | 14490 | -0.028 | -0.6941 | No | ||
| 30 | CBL | 19154 | 14583 | -0.031 | -0.6968 | No | ||
| 31 | FOS | 21202 | 14780 | -0.038 | -0.7045 | No | ||
| 32 | FGFR2 | 1917 4722 1119 | 15859 | -0.122 | -0.7536 | No | ||
| 33 | PLAU | 22084 | 16023 | -0.151 | -0.7512 | No | ||
| 34 | PAK4 | 17909 | 16487 | -0.272 | -0.7560 | No | ||
| 35 | GRB2 | 20149 | 17370 | -0.613 | -0.7583 | Yes | ||
| 36 | MAPK3 | 6458 11170 | 17396 | -0.634 | -0.7128 | Yes | ||
| 37 | JUN | 15832 | 17458 | -0.677 | -0.6662 | Yes | ||
| 38 | GAB1 | 18828 | 18101 | -1.234 | -0.6097 | Yes | ||
| 39 | STAT1 | 3936 5524 | 18114 | -1.257 | -0.5176 | Yes | ||
| 40 | PTK2B | 21776 | 18118 | -1.260 | -0.4247 | Yes | ||
| 41 | SPP1 | 5501 | 18120 | -1.261 | -0.3317 | Yes | ||
| 42 | PDPK1 | 23097 | 18147 | -1.308 | -0.2366 | Yes | ||
| 43 | MAPK1 | 1642 11167 | 18573 | -3.548 | 0.0023 | Yes |